


Getting Ahead of the NFV Complexity Curve with Advanced Visualization
In my conversations about NFV with customers, one of the concerns that often arises is that the service delivery model is more complex than traditional hardware-based networks. Is this true? I would have to agree with this point, and also consider this as one of the primary reasons why production NFV deployments – although accelerating of late – are progressing at a slower rate than many of us predicted a few years ago.
A major part of NFV’s overall complexity is certainly tied to the number of new technologies involved, but it’s also related to difficulties in understanding the relationships between the various virtualized resources that comprise an NFV service such as virtual network functions (VNFs), virtual machines (VMs), and the virtual pathways that link everything together.
The good news is that Ciena’s Blue Planet orchestration software recently introduced a number of advanced visualization features that leverage the new ETSI NFV Release 2 specifications to simplify NFV service lifecycle management for our customers, helping to address the complexity challenge. Here are some more details:
First, it’s important to highlight one of the key elements from the latest update to the NFV standard. NFV Release 2 introduced a number of advances designed to improve overall interoperability and operationalization. This includes a standard information model, which defines the characteristics of the various managed objects within NFV so that administrators and management systems can control solutions from different manufacturers and sources in the same way. This crucial effort laid the groundwork for Ciena’s introduction of the new NFV service visualization features in Blue Planet orchestration.
Visualizing the Future of NFV
How does visualization relate to simplifying NFV? Simply put, good visual tools help us better understand complex concepts. For readers familiar with Blue Planet, you already know that advanced visualization is not new to the platform. In fact, our original Planet Operate software was the first to introduce the concept of multi-layer network visualization for simplifying the management of complex physical networks comprised of different technology layers. Now, Blue Planet has introduced intuitive visualization for NFV to help simplify monitoring and management of our increasingly virtualized networks.
With this enhancement, Blue Planet now provides the ability to fully visualize the end-to-end flow of a network service being provided to a customer. As displayed in the Blue Planet screenshot below, the user interface (UI) clearly showing the various virtual and/or physical components that comprise a service, and the relationships between them, allowing customers to troubleshoot NFV deployments more efficiently, and simplify overall service lifecycle management.
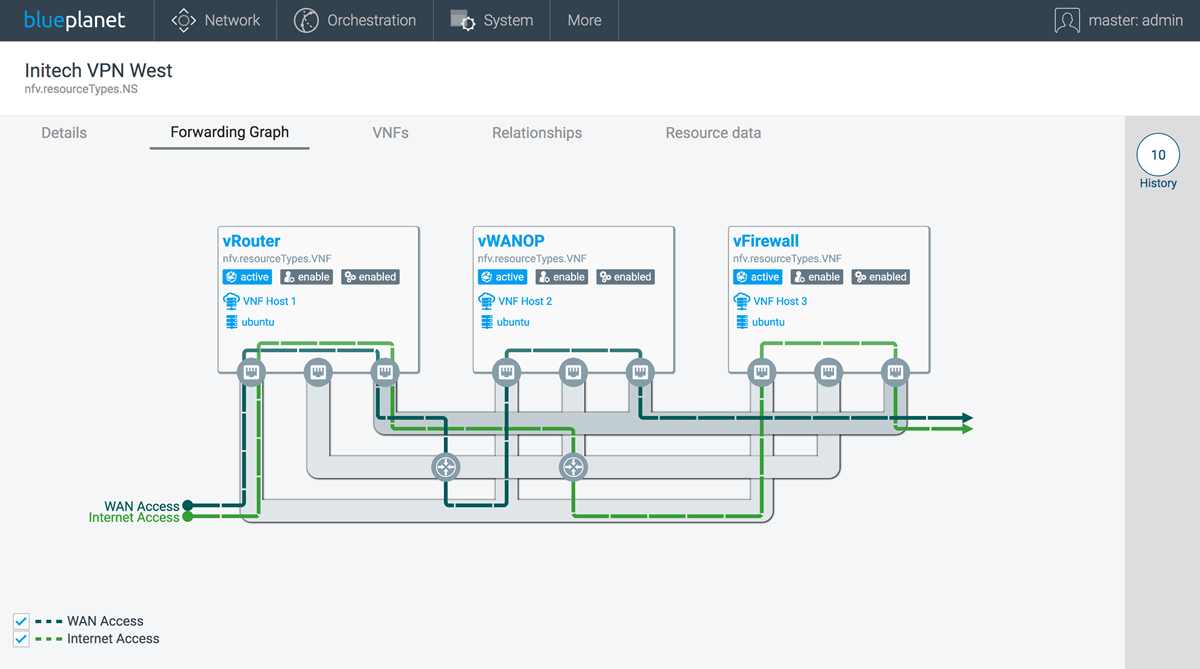
The new UI provides a real-time view that is dynamically updated to reflect changes in the network service or the addition/removal of a VNF from the service chain. Further, operators can drill down on various elements to access further details on individual VNFs and network services, as well as hyperlinks to supporting resources.
Real-time visualization enhancements like the one above represent a significant milestone, not just for our Blue Planet platform, but for the industry at large by simplifying and accelerating NFV deployments.
How can you get ahead of the complexity curve? You’ll have to “see it” for yourself… with Blue Planet.