


How planners, operations teams and executives can use Ciena’s Optimization Service
Network providers collect vast amounts of telemetry data from their infrastructure, but the data is contained in unwieldy spreadsheets or their data lakes, and typically presented without context. As a result, the data is often left unused. Providers need tools that continuously update the data, generate actionable intelligence and predictive analytics, and display the information in easy-to-view formats so providers can improve and optimize their networks.
One option is to build the tools in-house. But analytics solutions are costly―and tricky―to build and require special expertise. The development cycle is also lengthy, often taking years before a solution is mature enough for use on a live network.
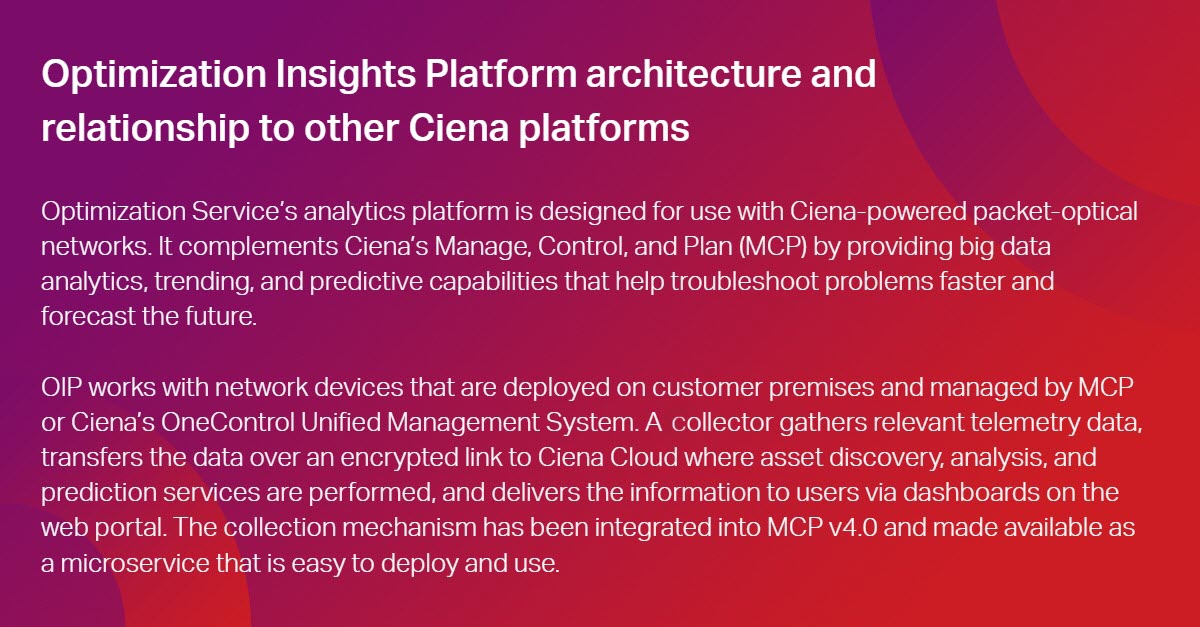
A more powerful and convenient approach is Ciena’s Optimization Service. It’s a cloud-based analytics subscription service powered by the Optimization Insights Platform (OIP), available as a DIY analytics platform or enhanced in combination with Ciena’s white-glove professional services.
OIP converts mountains of raw data from a provider’s packet-optical network into metrics that characterize and predict network capacity and health, and alerts for availability threshold breaches. Interestingly, OIP began with Ciena’s Insights Service, introduced in 2018 and used around the world. Providers can adopt the service and applications on a subscription basis, without needing to build a custom solution.
So how can capacity planners, operations teams, and executives use OIP to get the best performance out of their networks? Here are three use cases of the service in action.
Use Case #1: Capacity planning for strategic growth and new business
Network capacity planners must figure out how to expand capacity to support their business strategies, meet quality of service (QoS) requirements, and ensure resources are available to quickly fulfill service orders. OIP helps planners improve and streamline this work.
Expanding capacity to support business growth and ensure QoS: Planners must reconcile sales and business forecasts against current utilization trends to determine where capacity must be added to the network. OIP provides a network capacity dashboard that enables planners to visualize network configuration and current capacity utilization on a geographic map, predict capacity needs based on expected growth, and help determine the best paths for routing traffic. Planners can also use the feature to expand capacity in specific markets, regions, or communities if increases in network demand are impacting performance or QoS.
Expediting sales for service orders: When sales teams submit customer service orders, capacity planners must make sure network resources are available so the service provider can quickly confirm the orders and close the sales. Planners can use OIP capacity dashboards to view the network environment, specify where the customer needs services, and see if a channel is available so it can be reserved. If no channels are available, the feature can help establish if there are ports that can be provisioned to support the service. Compared to manual methods using spreadsheets, the automation features built into the application dramatically reduce the time required for this work.
Use Case #2: Helping operations prevent outages and assess customer QoS
Operations teams need comprehensive real-time information about the health of the network so they can keep the network up and running. They need to spot service-related issues before problems arise and cause outages. They also need ability to assess the quality of service customers are receiving. If an outage or QoS issue occurs, teams need to troubleshoot the problem and resolve it as soon as possible. Optimization Insights Platform enables teams to perform this work better and faster.
Identifying issues to prevent outages: OIP offers a network health dashboard that reveals issues that threaten the reliability of the network—even issues that are often overlooked. The application monitors each port in the network, determines the risk level for each port based on machine learning analysis of performance metrics reported, and flags ports as high, medium or low risk if they show a sudden change in performance. The results are graphically displayed so teams can visualize network conditions instantly.
For example, the network health application enabled a European Tier 1 provider to detect a drop in receive power for a particular port, even though the power level was still within acceptable range and would not have been detected by conventional fiber management tools. The application flagged the port as high risk and a ticket was subsequently generated. An on-site inspection revealed trapped fiber in the chassis as well as incorrectly routed fibers. Teams resolved the problems to restore performance, avoiding a potential outage.
The application flagged the port as high risk and a ticket was subsequently generated. An on-site inspection revealed trapped fiber in the chassis as well as incorrectly routed fibers. Teams resolved the problems to restore performance, avoiding a potential outage.
Leveraging more than 4 billion data points: The network health application not only monitors a company’s network health, it uses a global learning mechanism to compare the network’s performance against networks operated by other providers that use the application. This learning capability, informed by more than 4 billion anonymous network data points collected by OIP to date, enables providers to understand how equipment should perform when it is behaving normally, a perspective that is not available with siloed solutions.
Cost savings can be substantial. Assuming an average cost of $1.4 million per hour* for an unplanned outage for a communications service provider (CSP), a recent Ciena analysis, performed for a Tier-1 service provider in the United States, found that the health application saved $7.4 million in potential outage-associated costs. The application can quickly pay for itself.
Assessing end-customer availability and QoS: Sometimes a provider’s network will appear to be operating as it should, yet customers aren’t receiving the service levels they expect. OIP’s optional Service Level and Network Availability (SLNA) portal can go beyond the edge of the provider network to identify customer service end points, monitor the availability and QoS that end customers receive, and determine if there is an underlying issue with services provided by “last mile” operators. Network providers can use this capability to troubleshoot issues and ensure they are delivering a high-quality customer experience and adhering to service-level agreements (SLAs). CSPs also can provide their customers web-portal access to monitor and report on their availability and QoS parameters.
Use Case #3: Reporting for business executives and end customers
Internal company leadership and end customers need to understand the overall performance of their networks. Optimization Insights Platform provides an interactive dashboard that can function as a network home page for business executives. Network provider executives can use the application to get a big-picture view of network capacity, availability, and overall network health and risks. Enterprise customers can use their dashboard to see how much data they are using, the data speeds they’re receiving, and QoS metrics. The tools improve decision-making, ensure good customer service, and strengthen customer relationships.

Optimization Insights Platform: A mature, proven, and beneficial tool for network providers
Network providers need actionable metrics from their packet-optical infrastructure so they can optimize their systems and operate more agile, adaptive networks. As Ciena’s Optimization Service’s analytics engine, OIP delivers this intelligence via a mature analytics-as-a-service that is very easy to use, versatile, and powerful. Key use cases include 1) capacity planning for strategic growth and new business; 2) helping operations prevent outages and assess customer QoS; and 3) reporting for business executives and end customers. Customer case studies and Ciena analyses show providers can gain significant operational and performance benefits and business efficiencies from the solution.
Leveraging OIP as either a DIY tool or with our professional services, Ciena’s Optimization Service makes sure your network always operates at peak performance. It’s raison d'être, it’s purpose, is to help you achieve the operational and business outcomes that drive you. Whether you seek to exploit underutilized capacity to launch new services or resolve issues before they become issues, knowing as much as possible as early as possible gives you the edge you need.
* Cost of Downtime and the Value of Support Contracts Survey, IDC, 2020