8 Slides from Mary Meeker’s 2016 internet and bandwidth trends
 Richard van der Draay is an Australian business journalist focusing on telecommunications, networking technology and cyber security.
Yes, you’ve guessed it. It’s that time of year when Mary Meeker’s much anticipated treasure trove of insights and analysis hits the desks and screens of those who have an interest in all things internet, video, mobile – and, of course, bandwidth.
Kleiner Perkins Caulfield & Byers general partner Meeker – a former Wall Street analyst – has been providing her annual overview of industry trends for some two decades, and this year’s edition once again features a host of invaluable data. So, let’s review some of the findings, focusing mainly on bandwidth growth and usage.
Image sharing
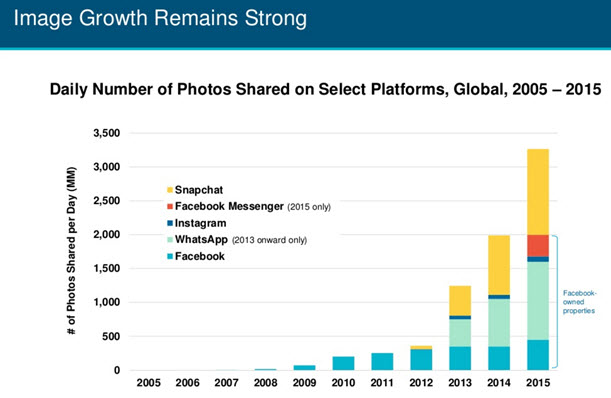
Interestingly, the 2016 study tips image sharing and messaging as key drivers of Internet traffic going forward. In fact, some 3 billion images are currently being shared daily between Facebook, Facebook Messenger, Snapchat, Instagram, and WhatsApp, all of which apart from Snapchat are owned by Facebook.
Gen Y communications choices
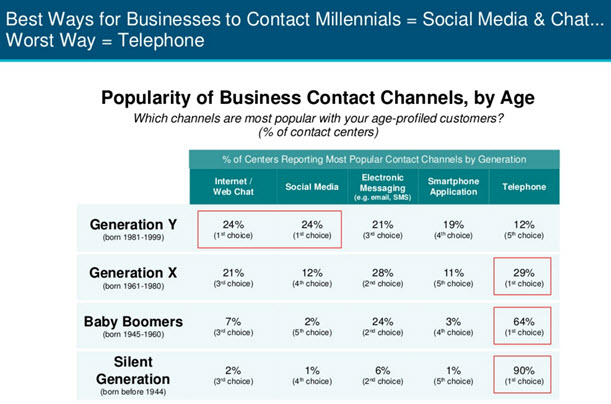
A Gen Y-centric finding indicated an inflection point around that age bracket’s preferences in communicating with businesses. According to Meeker, Gen Y is the first generation to clearly prefer talking to companies using the web or social media, as opposed to picking up the phone. Just 12% of this segment opted for the phone as their preferred method to contact businesses, while 29% of Gen X, 64% of Baby Boomers and 90% the Silent Generation – those born prior to 1944 – used the phone.
Smartphone users
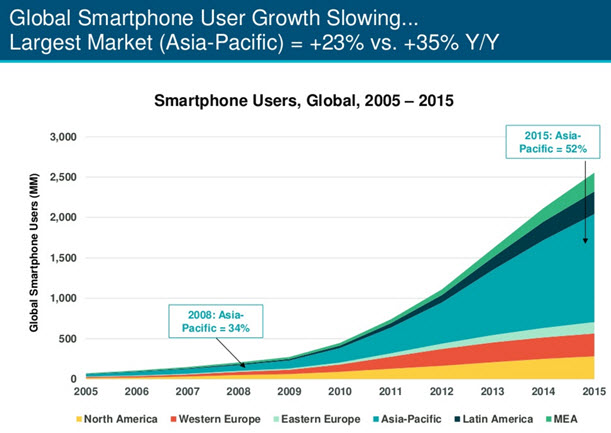
The year saw growth in total smartphone users slowing, rising just 21% year-on-year against 31% year-on-year growth in 2015. The largest smartphone market in terms of users was the Asia-Pacific region, accounting for 52% of the global share.
Smartphone shipments
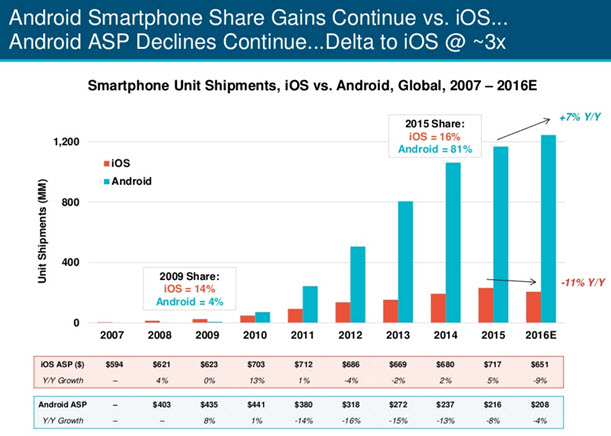
Worldwide smartphone units shipped dropped sharply to 10% year-on-year, versus 28% last year. Specifically, the Meeker report predicted that Apple shipments would remain on a downward curve, potentially declining by 11% this year, while Android shipments were expected to grow by 7% in 2016.
In addition, the report suggested that Apple could well cut its average handset price by 9% to $651, the biggest price drop ever for the company. Meeker attributed this anticipated move primarily to the cheap iPhone SE, as Apple embarks on a renewed campaign to lure more users. Meanwhile, the average selling price of an Android smartphone is expected to drop by 4% to $208.
Global data growth versus storage
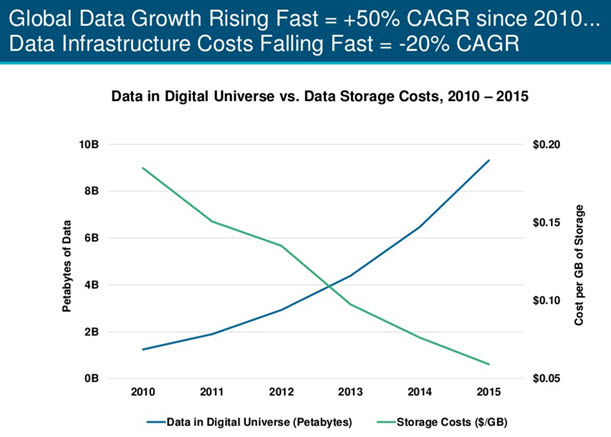
Global data growth saw a dramatic uptick, increasing at a CAGR of more than 50% since 2010, while data infrastructure costs were coming down fast, dropping by 20% CAGR.
Global Internet Users
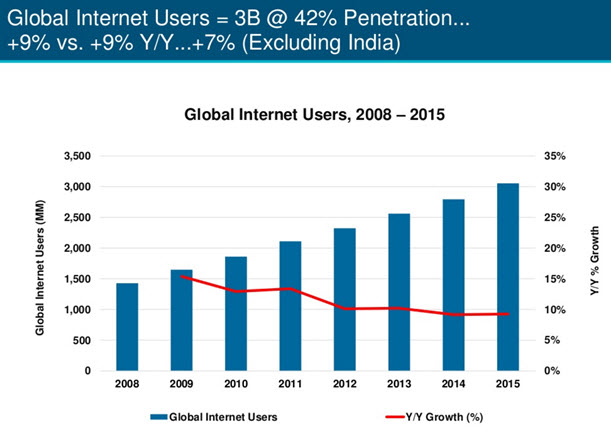
Overall Internet users hit the 3 billion user mark, which equates to 42% of the world’s population. However, growth in global Internet users proved to be flat, rising 9% year-on-year in a rerun of last year’s figure for this metric. More broadly, the study tipped that new Internet users would continue to be difficult to attract, due to high penetration across most developed markets.
India rising
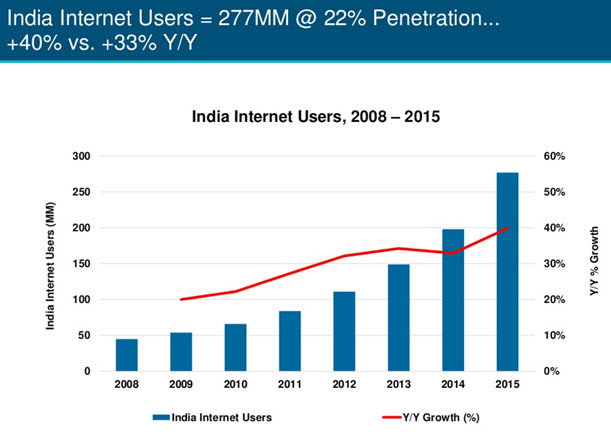
On the key metric of global Internet users, India outflanked the US to take the second spot in worldwide user market rankings – following hot on the heels of China.Internet user growth in the Indian market is accelerating, with that country seeing a 40% year-on-year increase compared to 33% in 2015. At the end of Q4 2015, India had 277 million Internet users, which amounts to 22% market penetration. (Slide 7-8)
Voice searching
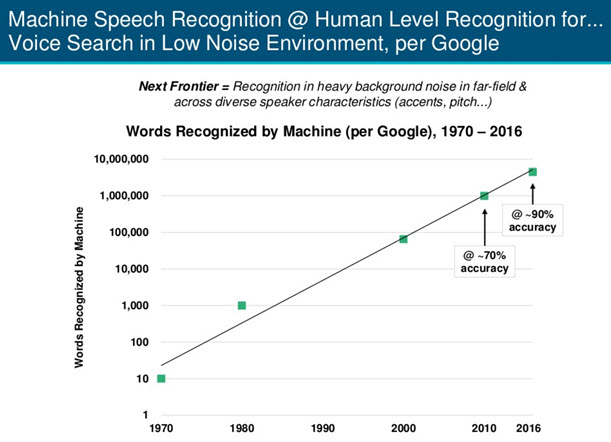
Another key trend clearly outlined was that voice-based search applications such as Apple Siri, Google Now and Microsoft Cortana were increasingly driving search traffic. According to the report, by 2021 at least 50% of all Internet searches will be made through either images or speech commands. It also found that speech recognition was rapidly becoming more accurate, increasing from 70% to 90% over the past five years.
